Features Conditions
See where the fire, the smoke and the bad air are
Fire season decides a lot of summer trips, and the three things that matter are rarely in the same place: where the fire is burning, where the smoke will be tomorrow, and what the air quality is. Vroam draws them over the map you are already planning on, from federal feeds, so you can rule a valley out before you drive into it.
How it works
-
Turn on Wildfires
Under Layers, in the Fire and air group, Wildfires draws active fire perimeters and named incidents from NIFC, with satellite hotspots once you zoom in. Tap a fire for its size in acres, containment percentage, discovery date and how far it is from you.
-
Drag the smoke forecast through time
Smoke drapes NOAA's HRRR-Smoke near-surface forecast over the map, and a time slider moves it forward so you can watch where the plume is headed. It runs about two days ahead in three-hour steps, for the lower forty-eight.
-
Check the air where you are going
Air quality draws NOAA's NAQFC forecast as a continuous field over the lower forty-eight, coloured by EPA category, with Good air left transparent so only degraded air shows. Blank is therefore the good case rather than a gap: most of the country is Good on most days, and drawing it would wash the map out. Outside the lower forty-eight there is no layer, and a spot you open carries its own air quality reading from a separate modeled source that works anywhere.
Two layers, two different questions
Wildfires and smoke are separate toggles under Layers. A fire perimeter is something you tap for detail; the smoke forecast is something you drag through time to see where it goes tonight. Air quality is a third toggle, and only one of temperature, smoke and air quality draws at a time. Both smoke and air quality stop at the edge of the lower forty-eight.
-
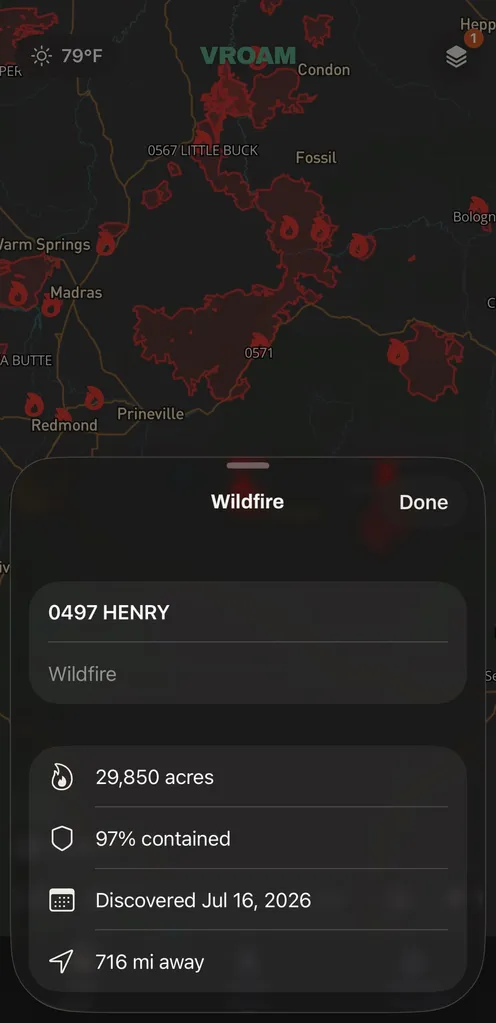
Wildfire detail -
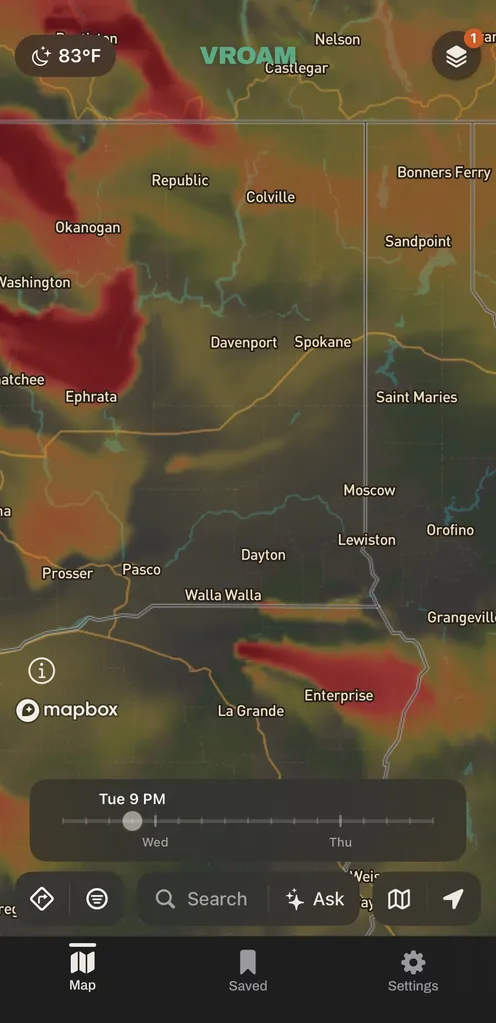
Smoke forecast
What makes it different
Fire, smoke and air sit on the same map as the places you would sleep, drawn straight from federal feeds, instead of living on three different websites you check after you have already committed.
What is the difference between a smoke forecast and air quality?
Both are forecasts now, so the difference is what the two measure. Smoke is near-surface particulate density from NOAA's HRRR-Smoke, about two days ahead in three-hour steps: it answers where the plume will be at nine tonight, down where you breathe rather than high overhead. Air quality is the EPA index from NOAA's NAQFC, and that index is defined over daily windows, the maximum eight-hour ozone and the twenty-four-hour average of fine particulate, so it answers what kind of day the air will be rather than what this hour looks like. They still disagree often, and now for a clearer reason: a three-hour plume can pass through and barely move a twenty-four-hour average, and ozone can push the index up on a day with no smoke in it.
Common questions
- Where does the wildfire data come from?
- NIFC, the National Interagency Fire Center: incident points and interagency perimeters, plus satellite hotspots from NASA and NOAA. Perimeters are simplified so they load on a phone, so treat the drawn edge as approximate. None of it is an official warning, evacuation or road closure notice.
- Do contained fires stay on the map?
- No. The feed keeps actively burning incidents, so a fire that reaches containment drops off the map rather than sitting there marked as contained.
- How far ahead does the smoke forecast go?
- About two days, in three-hour steps, and the earliest step is already a few hours old because the model takes that long to run. Drag the time slider to move through it. The smoke layer covers the contiguous states, not Alaska or Hawaii.
- Why is the air quality layer blank where I want to camp?
- Most likely because the air there is forecast Good. The layer colours NOAA forecast air by EPA category and leaves anything the index calls Good drawn transparent, on purpose: Good covers the large majority of the country on a normal day, and painting it would bury the areas that actually matter. The other reason is geography, since the layer stops at the edge of the lower forty-eight. Either way, open a spot and it carries its own air quality reading from a separate modeled source that returns a value anywhere.
Vroam is coming to iOS, with Android in build.
Free to start. Pro is coming after launch.
Notify me at launch